
The Empty Chair at 2pm: What Your No-Show Rate Is Actually Costing You
Patient no-shows are a system problem, not a patient problem. Better reminder workflows, waitlist management, and calibrated overbooking can recapture $150K, $400K+ in lost revenue.
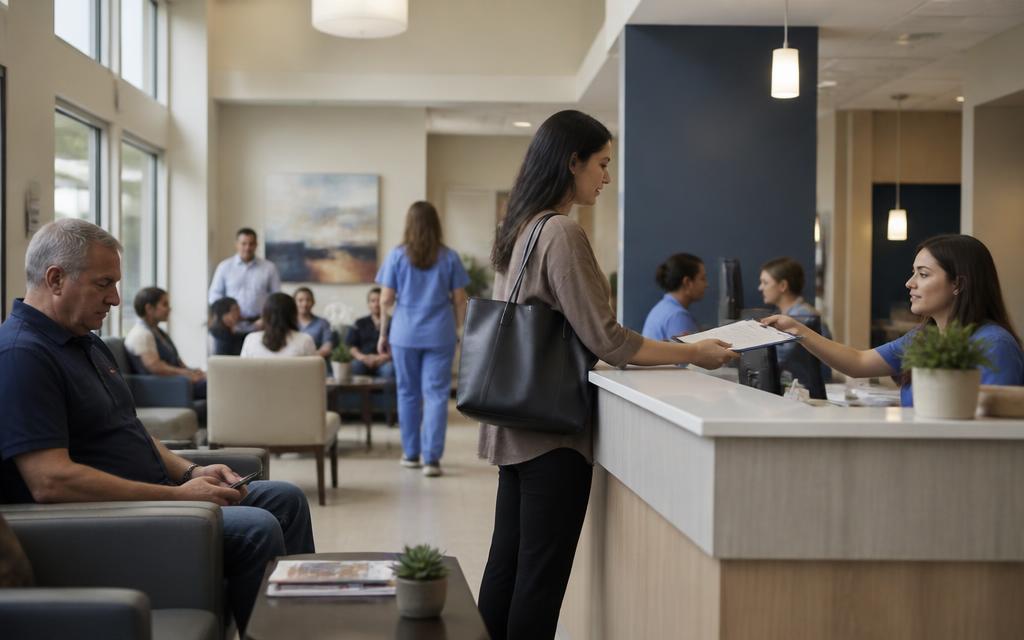
The schedule looked full. Every slot booked. The front desk had done their job. But by 2pm on a Tuesday, three chairs were empty. One patient called to cancel 20 minutes before their appointment. One didn't show. One had been double-booked into a slot that was already running 40 minutes behind, took one look at the waiting room, and left.
The physician finished the day early, which sounds like a gift until you do the math. Illustrative example: three empty slots at an average reimbursement of $180 per visit is $540 in one afternoon. Multiplied across 5 providers, 5 days a week, 48 weeks a year, a 10% no-show rate in a 20-provider practice can add up to a significant six-figure revenue gap over a year. The exact size of the gap depends on visit mix, reimbursement rates, and provider count.
Nobody fired anyone over it. Nobody even raised it at the next partner meeting. It was just Tuesday.
Access problems show up on the schedule, but they land in the revenue.
The Real Problem
No-shows get treated like an act of God in some practices. "Patients are unreliable." "That's just healthcare." These phrases can let a practice normalize a real revenue leak without asking why it is happening.
In practice, many no-show problems trace back to system design rather than patient behavior. Patients miss appointments because the reminder system is weak, because they can't reach anyone to reschedule, because the wait at their last visit was long enough that they decided it wasn't worth coming back, or because the appointment was booked weeks out and life happened.
Practices with lower no-show rates generally have not gotten lucky with their patient population. They have built systems that make it easy to show up and hard to disappear.
What Actually Works
Illustrative example: Consider a specialty practice with several providers running a 14% no-show rate. Physicians initially attributed it to an older patient population.
A closer look showed the real problem: the reminder system was weak. One automated text 48 hours before the appointment. No confirmation requested. No follow-up if the patient didn't respond. And when someone did cancel or no-show, the slot just sat empty.
They made three changes over 30 days:
First, they rebuilt the reminder sequence. Patients got a text 7 days out, another at 48 hours, and one the morning of the appointment. Each one asked for a confirmation reply.
Second, they created a waitlist. Patients who wanted an earlier slot got logged. When a cancellation came in, the front desk had actual people to call instead of staring at an empty chair.
Third, they added strategic overbooking. For the two providers with the worst no-show rates, they booked 1 extra patient per half-day session based on historical patterns.
In this illustrative example, the no-show rate drops from 14% to 6% within 90 days, recapturing about 1,400 visits annually. At $195 per visit, that is roughly $273,000 of illustrative recovered revenue. Actual results depend on payer mix, visit type, and starting no-show rate.
What to Do Monday Morning
- Pull your no-show and late cancellation rates by provider for the last 6 months
- Audit your reminder workflow: How many times does a patient actually hear from you before their appointment?
- Build a waitlist. Even if it's just a shared spreadsheet
- Look at your scheduling templates. If your third-next-available is more than 14 days out, you don't have a no-show problem, you have a capacity problem
- Start with one provider. Run the experiment. See what happens
Why This Matters
Revenue: The size of the opportunity varies by practice, but even a modest reduction in no-show rate can translate into meaningful recovered revenue without adding providers or hours.
Operations: Providers see full schedules. Staff spend less time managing empty slots.
Patients: People who want to be seen sooner actually get in sooner through the waitlist.
Strategy: Reducing no-shows is the fastest way to increase revenue without adding anything. Just fix what's broken.
What the current data shows
Two current datasets frame why an empty slot costs more than it used to.
- 73% of practices reported that no-show rates held steady or fell in 2025, per MGMA's August 2025 poll of 265 practices, while 27% saw increases. Steady is not the same as solved: the rate most practices are holding steady at is still material.
- The average wait for a new patient appointment reached 31 days across 15 large metro markets in 2025, up 19% since 2022 and 48% since 2004, per AMN Healthcare. OB/GYN averaged 42 days, gastroenterology 40, dermatology 36.5 and cardiology 33.
- Operating costs rose roughly 11% in both 2025 and 2026, per MGMA, so the fixed cost sitting behind each unused slot is higher than the last time you priced it.
The combination is the point. Patients are waiting a month to be seen while slots go unused the same week, and each of those slots carries more overhead than it did three years ago.
Unfamiliar with a measure in this article?
The plain-language glossary explains every operating measure we use, how it is calculated and why it matters. Current industry figures live on the State of Independent Practice page.
Found this useful?
Share it with a colleague or practice leader who would benefit.
Ready to Apply This to Your Practice?
Our advisory work turns these frameworks into measurable results for independent practices.